Restaurant Industry

Restaurants: September Sales Growth Not So Bad, But…
Data out today from the U.S. Census shows that restaurants’ market share (with grocery stores/supermarkets making up the other component) was 54.6% in September 2026.


Data out today from the U.S. Census shows that restaurants’ market share (with grocery stores/supermarkets making up the other component) was 54.6% in September 2026.
The latest Consumer Price Index (CPI) data shows that prices for food-at-home (grocery stores and supermarkets) rose by +1.8% in September — sequentially -40 basis points lower than August’s +2.2%. This +1.8% number for August compares with price for food-away-from-home (restaurants) that increased by +3.5% year-over-year in September (sequentially up by +10 basis points from August’s +3.4%). This marks the 42nd month in a row for which restaurant pricing is outpacing grocery/supermarket pricing.
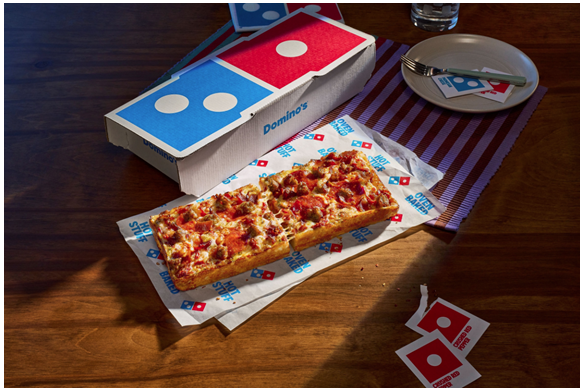
Earlier today (Tuesday, October 13th), Domino’s reported third-quarter EPS of $4.60. This was above our $4.25 forecast, and also above sell-side consensus (according to Consensus Metrix) of $4.37. The Q3 tax rate was 22.0%, equal to our 22.0% projection, and close to consensus of 22.2%.
With this report, we update our data-driven Kalinowski Restaurant Industry Index for Q3 2026 to +1.1%. This is a step back — about a percentage point sequentially lower than the Q2 2026 results. The weak Q3 was caused in part by food-safety issues, but also reflective of the challenges the restaurant industry continues to face in attracting business from folks who live in lower-income and middle-income households.
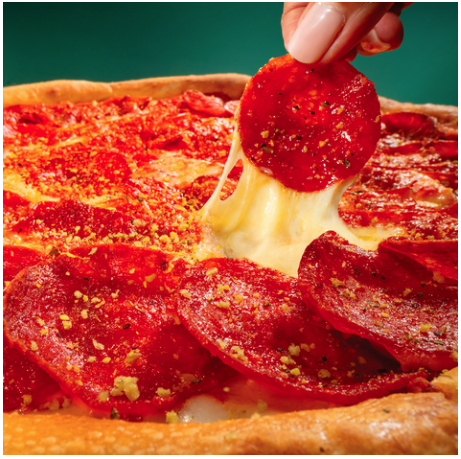
With this report, we update our data-driven Kalinowski Quick-Service Pizza Index for Q3 to -1.8%. Comparing to Q3 2019 levels — a pre-pandemic basis — the Kalinowski Quick-Service Pizza Index for Q3 2026 is at +24.0%. Our -1.8% figure is based on our latest proprietary checks/data as regards same-store sales performance for this segment during July, August, and September.

With this report, we update our data-driven Kalinowski Family Dining Index for Q3 to up by +1.5%. Comparing to Q3 2019 levels — a pre-pandemic basis — the Kalinowski Family Dining Index for Q3 2026 is at +13.7%. This is the lowest such number of any major U.S. restaurant industry segment. Our latest numbers are based on our latest proprietary checks/data as regards same-store sales performance for this segment during July, August, and early-to-mid September.